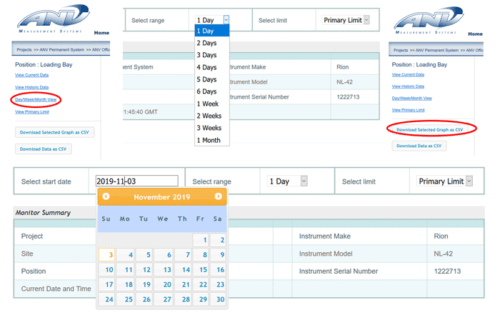
Really Useful Day/Week/Month View Feature added to Live Leq
There have been a lot of behind the scenes updates to LiveLeq and LivEnviro during 2019. LivEnviro was moved to a new server, for instance, and moving to the latest version of PHP has taken a lot of work.
New Features for LiveLeq
We have, additionally, added some really useful new user features, one of these being Day/Week/Month View for LiveLeq. LiveLeq is the noise monitor element of the LivEnviro platform – live to web noise, vibration, dust and weather all on a single website utilising site proven and certified sensors.
Downloadable Reports
We know a lot of people have to do weekly or monthly reports and we have already made it possible to download CSVs of hourly, 10 hourly periods (whatever periods your alerts have been set in). Incidentally the coding for this process has been improved and it is now quicker.
Rapid Downloads
The new feature displays daily (or several days), weekly or monthly historic data on the Live LEQ website for each of your selected limits. The graph can be downloaded directly as a png or jpg. You can also download the graph as a csv. This provides a very rapid and convenient way of seeing and downloading weekly, daily or monthly data It doesn’t contain quite as much information as a full csv download (date and time of exceedances for instance) however, the exceedances are indicated on the graph.
We hope you find this feature really useful. Let us have any comments. We will be rolling out this feature for Live PM10 and Live PPV in due course.

 Visit LivEnviro Website